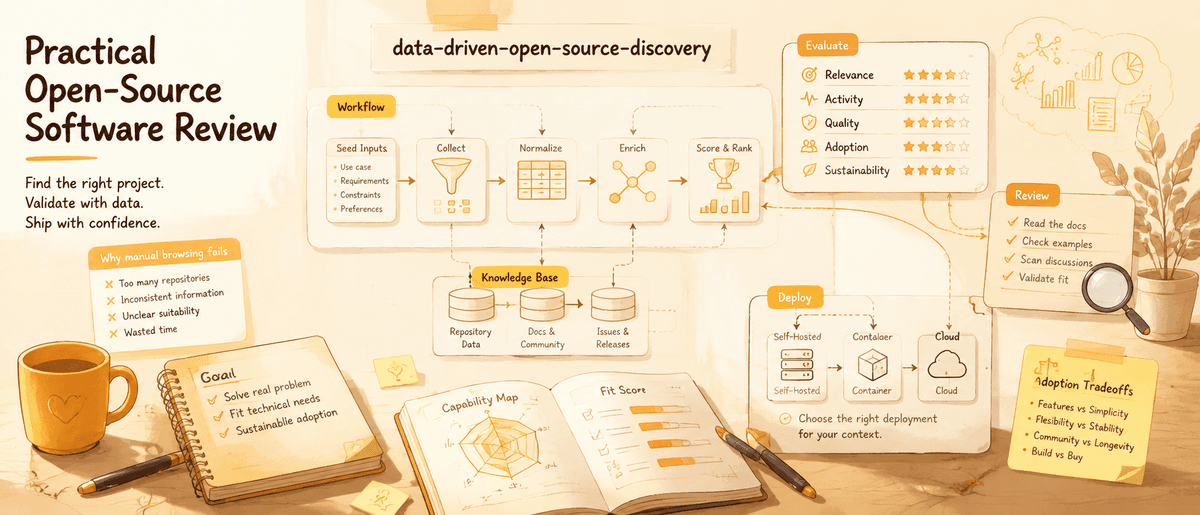
Building a Data-Driven Approach to Open-Source Discovery
Why browsing GitHub manually fails at scale, how data-driven discovery works, and what metrics matter most when finding projects that match your needs.
GitHub's public repository ecosystem is too large to evaluate by browsing alone. Even after narrowing to actively maintained projects with meaningful community engagement, teams still face more options than they can reasonably inspect by hand. The platform's native discovery tools—Trending, Explore, Topics—scratch the surface but cannot address the fundamental challenge: how do you find the right project for your specific needs when the search space is this large?
This is the problem that motivated Git-Stars. We built a data-driven discovery platform because we believe the current approaches—word of mouth, social media, and manual GitHub browsing—systematically bias toward well-marketed projects over well-engineered ones. Here is our thinking on why data-driven discovery matters and how we approach it.
The Limitations of Manual Discovery
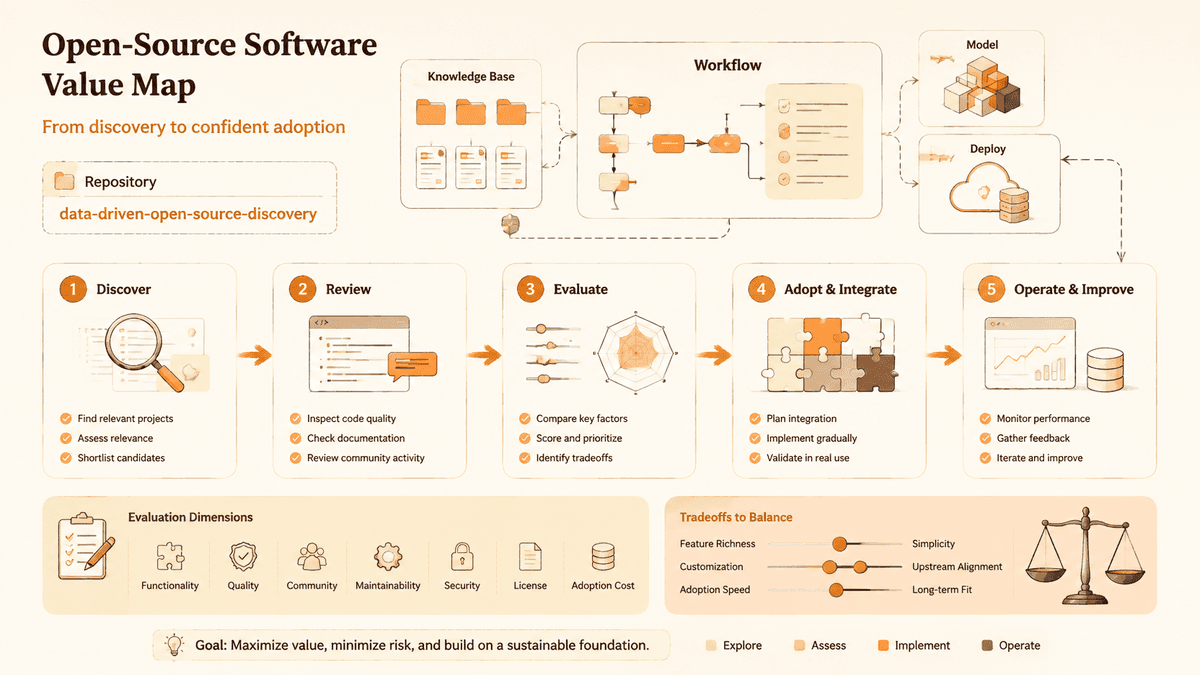
Most developers discover new tools and libraries through a small number of channels: Hacker News, Twitter/X, Reddit, colleagues' recommendations, and Google searches. Each channel has inherent biases.
Social media surfaces projects with good marketing—compelling READMEs, demo videos, and launch campaigns. This correlates with quality but not strongly. Plenty of excellent tools never get a launch campaign because their authors are engineers, not marketers.
Word of mouth propagates through networks, which means you discover tools popular within your specific community. If your team uses Python, you hear about Python tools. Cross-ecosystem alternatives that might fit better never enter your awareness.
Search engines index documentation and blog posts, biasing toward projects that invest in SEO. A project with five tutorial blog posts ranks higher than one with superior code but minimal web presence.
What Data-Driven Discovery Adds
A systematic approach to repository analysis can surface projects that manual discovery misses. By collecting and analyzing metrics across all public repositories, we can identify projects that are:
Growing quietly. Projects gaining contributors, downloads, and dependent repositories without social media buzz. These often represent the most reliable choices because their growth is organic rather than hype-driven.
Well-maintained but under-recognized. A library with 200 stars, weekly releases, sub-24-hour issue response times, and zero known vulnerabilities is often a better choice than a 10,000-star project with sporadic maintenance. Data makes these invisible gems findable.
Emerging in new categories. When a new problem space opens—say, LLM orchestration or WebAssembly tooling—the first-mover projects get attention, but later entrants that learn from early mistakes are often technically superior. Trend analysis surfaces these second-wave projects.
The Metrics We Track
Our analysis framework evaluates repositories across five dimensions:
Activity and maintenance. Commit frequency, release cadence, issue response time, pull request review time, CI/CD pipeline health. These tell you whether the project is actively maintained and how responsive the maintainers are.
Community health. Contributor count and diversity, organization backing, discussion activity, fork engagement (forks that contribute back versus forks that diverge). A healthy community indicates long-term sustainability.
Adoption signals. Package download counts, dependent repository counts, real-world mentions in production contexts. These distinguish starred-but-unused projects from actually-deployed software.
Code quality indicators. Test presence and coverage trends, documentation completeness, adherence to ecosystem conventions, dependency freshness. These proxy for engineering rigor.
Trajectory. All metrics above analyzed as trends over time rather than snapshots. A project improving across dimensions is a fundamentally different signal from one in decline, even if their current absolute numbers are similar.
Why Manual Discovery Systematically Fails: Real Examples
| Discovery Channel | Bias | What Gets Missed |
|---|---|---|
| Hacker News / Reddit | Favors novelty + drama | Stable tools with no "news hook" |
| Twitter/X | Favors personalities with followers | Solo maintainers without social presence |
| Google search | Favors SEO investment | Projects with great code but sparse docs |
| Colleagues | Favors your existing stack | Cross-ecosystem alternatives |
| GitHub Trending | Favors star velocity | Steady-growth projects below trending threshold |
| Conference talks | Favors funded projects | Bootstrapped tools without travel budgets |
A real-world example: in our tracking, several Kubernetes monitoring tools with 300?00 stars showed better issue-response times, more consistent releases, and fewer open CVEs than alternatives with 10,000+ stars. The well-known tools had launch campaigns and conference slots; the quieter ones had better engineering practices. Without systematic metrics, you would never compare them.
For a detailed look at what star counts do and don't measure, see our analysis of what GitHub stars actually mean.
Discovery Workflows
Different situations call for different discovery approaches:
Evaluating alternatives. You know the problem you need to solve—say, form validation in React. You want to compare all viable options across maintenance health, bundle size, API ergonomics, and community support. This is a filtering and ranking problem.
Exploring a domain. You are entering a new technology area and want to understand the landscape. What are the major players? What categories exist? Where is innovation happening? This is a mapping problem.
Tracking trends. You want to stay current with what is emerging in your stack without spending hours browsing. Which new projects are gaining traction? Which established ones are losing it? This is a monitoring problem.
Validating choices. You have already picked a dependency and want to confirm it remains a good choice. Is maintenance continuing? Are there emerging alternatives you should be aware of? This is a health-check problem.
Git-Stars supports all four workflows through different entry points—search and comparison views, category browsers, trend feeds, and project health dashboards.
The Human Element
Data-driven discovery does not eliminate judgment—it informs it. Metrics can tell you that a project is well-maintained and growing, but they cannot tell you whether its API design matches your mental model, whether its documentation will make sense to your team, or whether its architecture aligns with your constraints.
Our approach is to use data to narrow the field to a manageable set of candidates, then support deeper evaluation through structured project profiles, side-by-side comparisons, and historical trend data. The final decision remains yours—we just ensure you are making it with complete information rather than incomplete impressions.
Looking Forward
As the open-source ecosystem continues growing, the discovery problem will only intensify. We are investing in more sophisticated analysis—natural language understanding of README content, automated detection of architectural patterns, and personalized recommendations based on your existing technology stack.
The goal is not to automate decision-making but to make informed decision-making scalable. Every team deserves access to the best tools for their needs, regardless of whether those tools had a successful Product Hunt launch.
More Insights
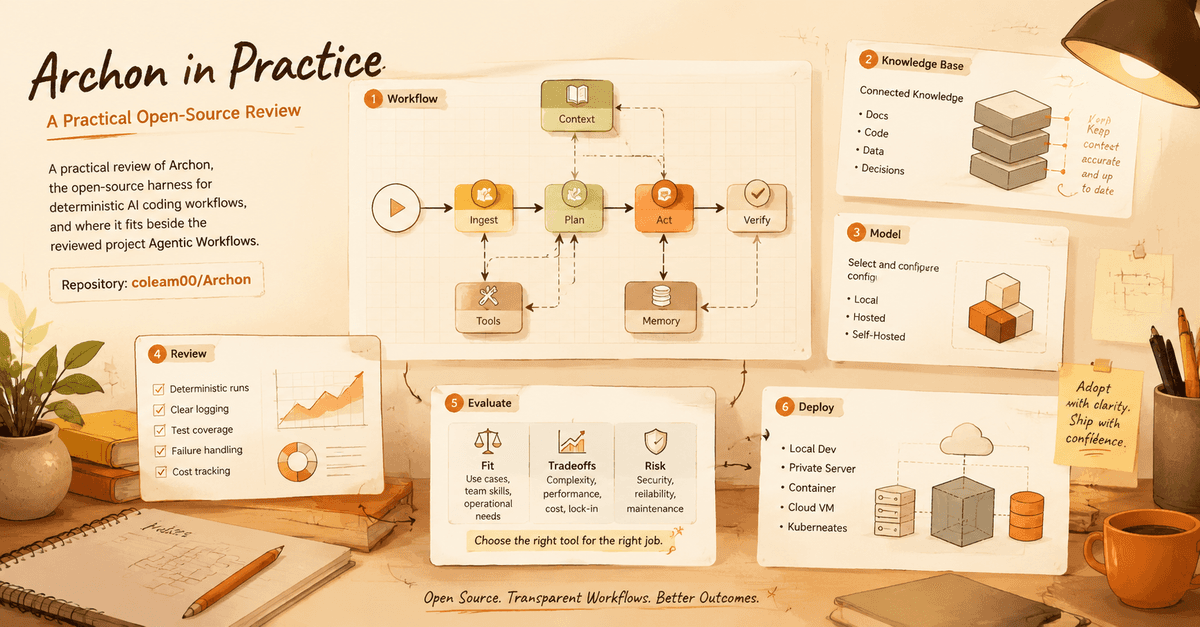
Archon: Can Agentic Coding Workflows Become Repeatable?
A practical review of Archon, the open-source harness for deterministic AI coding workflows, and where it fits beside GitHub Agentic Workflows.
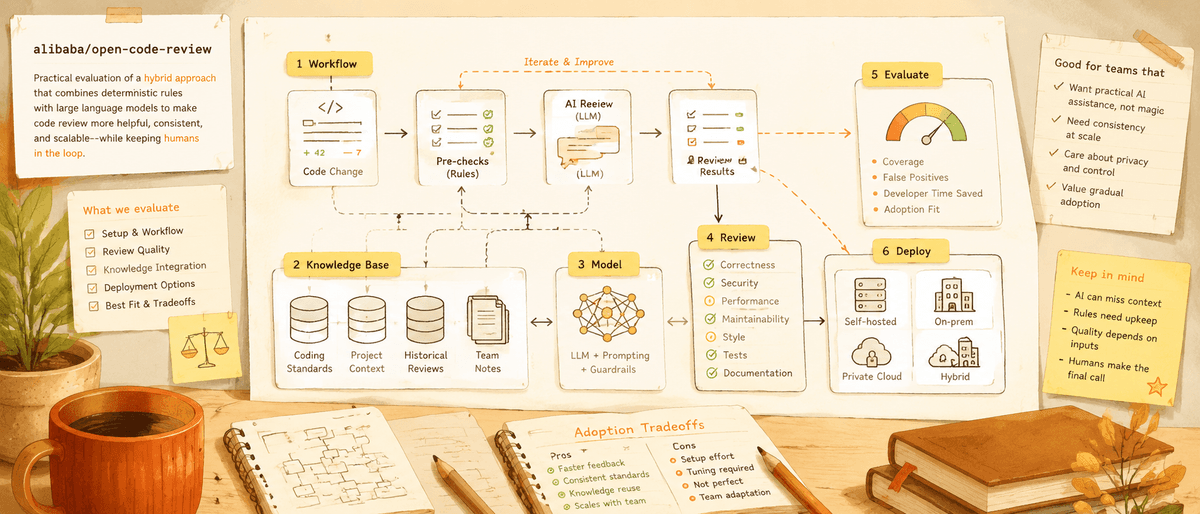
Alibaba Open Code Review: Where AI Review Helps and Where It Should Slow Down
A practical evaluation of Alibaba Open Code Review, its hybrid rules plus LLM approach, and the real limits of AI-assisted code review.
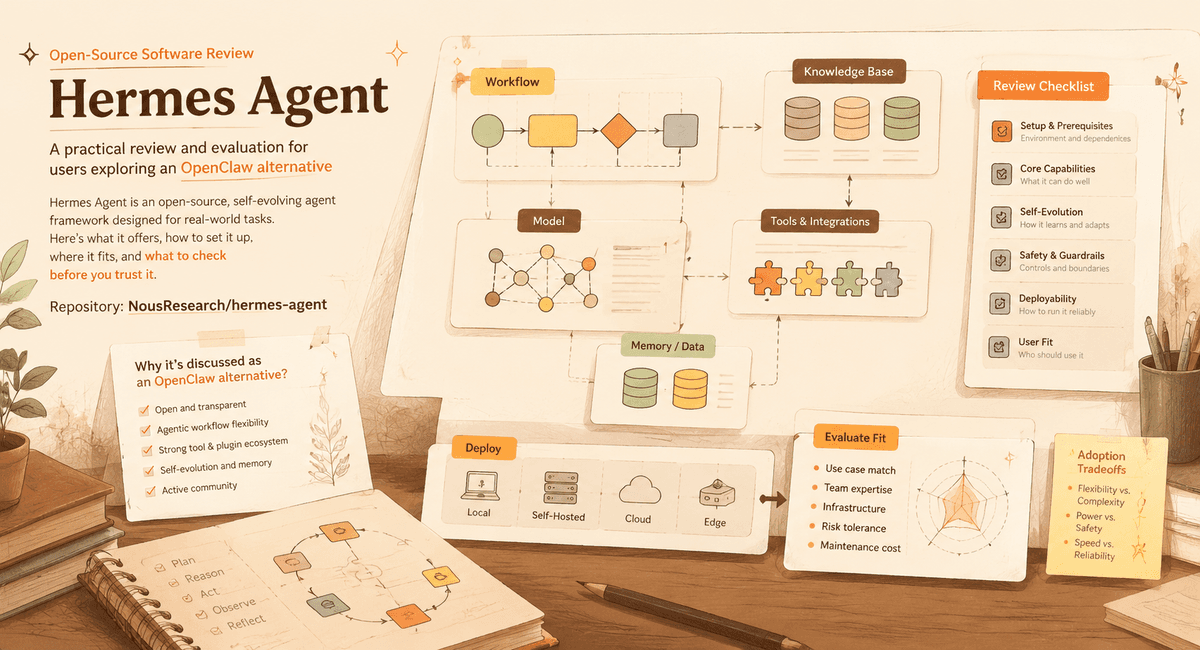
Hermes Agent: Self-Evolving AI Assistant or Another Agent Hype Cycle?
A Git-Stars review of Hermes Agent, why it is being discussed as an OpenClaw alternative, and what users should check before trusting a self-evolving agent.
Newsletter
Join the community
Subscribe to our newsletter for the latest news and updates